Water well systems operate under conditions that differ from ordinary municipal distribution pipelines. Groundwater levels fluctuate, pumps work against changing hydraulic head, and sediment or seasonal demand can affect output. A stable flow rate today does not necessarily mean the same pumping conditions will exist next month.
A water well flow meter gives operators measurable information about delivered water volume and changes in pumping performance. When combined with pump runtime, electrical input, water level, and discharge pressure, flow data can help identify declining output and support more informed operating decisions.
Why Water Well Flow Monitoring Matters
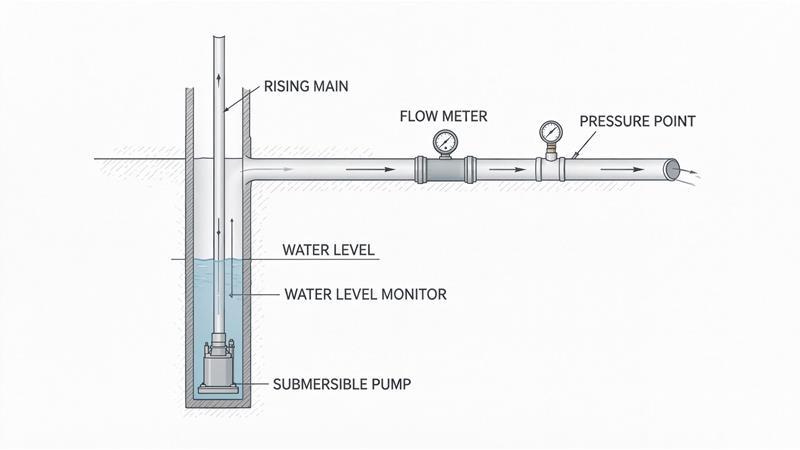
In a conventional supply pipeline, operators often monitor water delivery between established distribution points. A well system requires additional attention to the relationship between groundwater conditions, pump operation, and discharge flow.
A reduction in well output may indicate a change in dynamic water level, increased discharge resistance, or reduced pumping performance. Flow data helps reveal the change but does not identify its cause independently.
For agricultural, municipal, and industrial groundwater projects, flow meters for water wells can provide continuous records of water production.
Operators should collect instantaneous flow, accumulated volume, and pump operating hours. These measurements establish a baseline for comparing performance across different operating periods.
How Flow Data Helps Evaluate Pumping Performance
Flow trends are most useful when measurements are compared under similar operating conditions.
For example, if a pump previously delivered a certain volume at a defined discharge pressure and water level, a sustained reduction under comparable conditions deserves investigation.
The flow rate of water can be reviewed alongside electrical power and pump runtime to evaluate specific output.
Useful indicators include total water delivered per pumping cycle, average flow during stable operation, and water volume produced per unit of electrical energy.
| Monitoring Indicator | What It Helps Evaluate |
|---|
| Instantaneous discharge flow | Current water production |
| Daily accumulated volume | Total daily output |
| Flow at similar discharge pressure | Changes in pumping performance |
| Flow versus dynamic water level | Influence of groundwater conditions |
| Water volume per kWh | Overall pumping-system productivity |
| Flow versus pump runtime | Output consistency across operating cycles |
However, flow alone cannot determine true hydraulic pump efficiency. That calculation also requires reliable head and input-power information.
Hydrostatic Pressure and Water Head Calculation
Groundwater level and discharge pressure can also help engineers understand changes in pumping conditions.
Where pressure represents a static liquid column, the corresponding hydrostatic head can be calculated as:
h (m) = [P (kPa) × 1000] / [ρ (kg/m³) × 9.81]
Where:
h = Hydrostatic water head, in meters (m).
P = Hydrostatic gauge pressure, in kilopascals (kPa).
ρ = Water density, in kilograms per cubic meter (kg/m³).
9.81 = Gravitational acceleration, in meters per second squared (m/s²).
Calculation Example
For water with a density of 1,000 kg/m³ and a hydrostatic pressure of 10 kPa:
h = (10 × 1000) / (1000 × 9.81)
h ≈ 1.02 m
Therefore, 10 kPa of hydrostatic pressure corresponds to approximately 1.02 meters of water column under these assumptions.
This calculation is useful for understanding static water head. However, flowing discharge-pipe pressure is not automatically equal to groundwater depth or total pump head. Accurate pumping-efficiency assessment must also consider elevation, velocity, hydraulic losses, and electrical input.
What Can Cause Low Water Output?
A reduction in measured flow does not automatically indicate mechanical pump damage.
During extended pumping, the dynamic water level may decline, increasing the lift required from the pump. Seasonal groundwater conditions can also change the available water supply.
Other possible contributors include partially closed valves, additional pipeline resistance, sediment accumulation, air entering the system, or operating changes in variable-speed pumps.
The pattern of flow reduction can help determine what should be checked next.
A gradual decline under similar operating conditions may suggest a developing system problem. A sudden change following valve adjustment or equipment operation may have a different explanation.
Rather than treating every low reading as a repair issue, operators should compare flow against water level, discharge pressure, operating speed, and electrical consumption.
Installation Requirements Specific to Well Pump Systems
A flow meter for water pump applications should be installed at a discharge location that provides stable measurement conditions.
Avoid placing the instrument immediately downstream of elbows, check valves, pumps, or control valves unless the selected meter permits that arrangement.
The measurement pipe should remain completely filled during operation. High points that trap air can disturb readings, especially during startup or after the well has been offline.
For JUJEA's electromagnetic water flow meter, the published flow measurement range corresponds to a liquid velocity of 0.5–5 m/s, and the required liquid conductivity is at least 50 µS/cm.
These requirements should be checked against the well's minimum and maximum discharge rates and actual groundwater conductivity. A large pipe diameter does not necessarily mean that a larger flow meter is appropriate.
Sediment-bearing groundwater requires attention to electrode or liner compatibility, deposits, and maintenance access. JUJEA offers rubber and PTFE lining configurations, with suitability depending on the selected model and medium conditions.
Where the installation is outdoors, confirm enclosure protection, power supply, surge protection, and cable routing.
The meter should also remain accessible for inspection without interfering with pump removal or other well maintenance activities.
Choosing a JUJEA Water Well Monitoring Solution
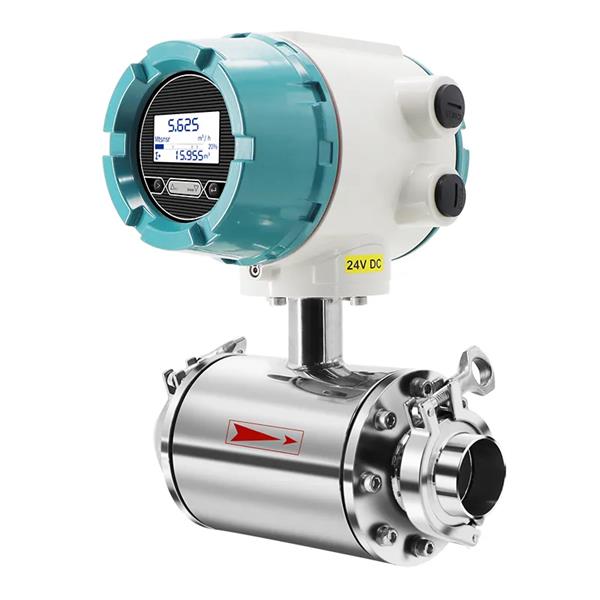
JUJEA offers electromagnetic water flow meters for suitable conductive-water applications.
Its water flow meter product specifications include the following technical parameters.
| Technical Parameter | JUJEA Water Flow Meter Specification |
|---|
| Measurement principle | Electromagnetic induction |
| Nominal diameter | PTFE-lined: DN10~DN500; rubber-lined: DN65~DN1200 |
| Accuracy class | Class 0.5 ; Class 1.0 |
| Flow velocity range | 0.5–5 m/s |
| Fluid conductivity | ≥50 µS/cm |
| Pressure class | 1.0 MPa(higher pressure available by customization) |
| Medium temperature | Ordinary rubber lining: -20 ~ +70℃; PTFE lining: -20 ~ +120℃ |
| Signal output | Pulse, 4–20mA, RS485 |
| Power supply | 220V, DC24V; Battery power supply |
Its published product information includes different measuring diameters, liner and electrode options, and industrial signal outputs.
When evaluating a water flow meter manufacturer, buyers should confirm groundwater conductivity, normal and minimum flow, pipe dimensions, discharge pressure, installation space, and sediment conditions.
Project specifications should also identify whether the meter is needed for production reporting, operating trends, water-use accounting, or performance assessment.
JUJEA can review these parameters and recommend a suitable configuration from its available water measurement products.
Conclusion
Water well flow monitoring provides a practical way to understand water production and detect changes in pumping-system performance. Instantaneous flow, accumulated volume, runtime, water level, pressure, and electrical consumption are more informative together than any single reading. A lower flow rate may reflect groundwater conditions, system resistance, operating changes, or equipment deterioration, so diagnosis should use multiple measurements. JUJEA water flow meters can support continuous discharge monitoring in suitable well systems. Buyers should verify groundwater conductivity, flow velocity, pipe dimensions, installation conditions, and instrument specifications before selecting a meter for long-term groundwater production monitoring.
Frequently Asked Questions
Can a flow meter determine the exact cause of pump efficiency loss?
No. It identifies output changes, but pressure, water level, power, and operating data are needed for further assessment.
Should a flow meter be installed inside the well casing?
Not necessarily. Many applications place the meter on the accessible discharge pipeline.
Can groundwater sediment affect a flow meter?
Yes. Sediment may cause deposits or abrasion, depending on the meter design and operating conditions.
Is accumulated water volume more useful than instantaneous flow?
Both are useful. Instantaneous flow reveals operating changes, while totalized volume records production.
How should variable-speed pump operation be evaluated?
Compare flow at similar speeds, discharge heads, and groundwater conditions.
What information should be supplied with an inquiry?
Provide well discharge pipe size, flow range, water quality, pressure, temperature, installation layout, and required outputs.
Ethan Liu
Ethan Liu is JUJEA's technical content specialist, translating complex sensor integration and industrial automation concepts into practical insights for engineers, system integrators, procurement professionals, and decision-makers worldwide.


 한국어
 français
 Deutsch
 Español
 italiano
 русский
 português
 العربية
 tiếng việt
 čeština