The decision between a paperless recorder and a chart recorder is rarely about recording accuracy — both capture a 4–20 mA signal faithfully. It is about three things that only show up after installation: where the record physically lives, how much panel depth and consumable handling the instrument needs, and how long it takes to produce that record when a customer, auditor or shift supervisor asks for it.
This comparison is written for engineers and maintenance managers who already have a chart recorder on the panel, or a specification that still names one. It uses the R72 touch color paperless recorder as the worked example on the digital side, and it treats the cost question as an arithmetic exercise rather than a price tag.
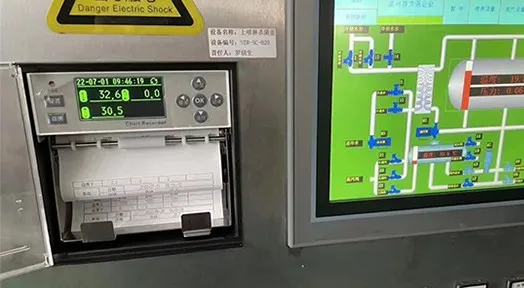
A paper recorder still in service: the trace is continuous, but the record has to be removed, filed and stored by hand.
Where the Record Actually Lives
A chart recorder stores its record on a physical medium — a circular or strip chart driven by a mechanical or stepper drive, traced by one or more pens. The record is analogue and continuous, and it is readable by anyone standing at the panel without a screen, a login or a laptop. That is a genuine advantage, and it is the reason chart recorders survive in plants where the strip is signed at the end of a shift.
A paperless recorder stores the record as digital data in internal memory and reproduces it on a display. The R72 uses 64 MB of internal memory with dynamic cyclic overwrite, writing at an interval you select from 1 second to 1 hour, and it presents data four ways on a 7-inch colour touch screen (800 × 480 px): digital values, bar graphs, dashboard and trend curves, with a historical curve view for looking back.
The practical difference is not "paper versus pixels". It is that:
- The chart recorder's record is simultaneously the storage medium and the display. There is no export step, and also no backup step — what is on the paper is all there is.
- The paperless recorder's record is copied out, not observed on the medium. Data leaves the panel by USB export (a daily automatic export can be scheduled), by Modbus RTU or Modbus TCP for live values, or as a 4–20 mA retransmission for a legacy controller.
That last point is the one to design for. A paperless recorder with no export discipline is a chart recorder with extra steps, except that its memory overwrites silently instead of running out of paper loudly.
Panel Space, Depth and Handling
Chart recorders consume panel depth. The paper path, the chart drive and the pen carriage all sit behind the front bezel, and charts have to be accessible for replacement. Before specifying a replacement, measure the depth behind the panel — that number, not the cut-out, usually decides whether a straight swap is possible.
The R72 (GT72R) is an indoor panel-mounting instrument with a 138 × 138 mm cut-out, a body of 187 × 147 × 145 mm, a net weight of 1.1 kg, and IP65 protection at the panel face. Because it has no paper path, its depth requirement is fixed and shallow, and there are no consumables to reach for. In practice that means:
| Task | Chart recorder | Paperless recorder (R72) |
|---|
| Routine operator action | Change charts and pens on a schedule | None — the record is continuous in memory |
| Consumable inventory | Charts, pens, ink or ribbons | None; USB media for exports |
| Handwritten annotation | Yes, directly on the chart | Via channel tags, configurable titles and the print function (optional TTL micro printer) |
| Reading the trend at the panel | Always visible | Always visible on the touch display; navigation bar hides after 8 seconds |
| Getting the record off the panel | Remove and file the chart | USB export, Modbus, 4–20 mA or print |
None of this makes one instrument "better". It makes one of them cheaper to run and easier to retrieve from, and those are the two axes where the arithmetic is worth doing.
Data Integrity: Different Weaknesses, Not Different Standards
Engineers often assume digital means tamper-proof. It does not. Both technologies have failure modes that matter in an audit, and they are not the same failure modes.
Where a chart recorder is strong: the record is a physical artefact with no firmware, no clock battery and no password. Where a quality procedure requires a signed paper strip at the end of a batch or shift, that requirement is met by the medium itself.
Where a chart recorder is weak: the record degrades. Pens clog or run dry and leave a flat line that is indistinguishable from a process that genuinely did not move; chart changes create gaps that must be annotated by hand; ink smears; paper absorbs humidity. Retrieval cost is also real — a chart from eleven months ago is a physical object in a cabinet, and someone has to find it.
Where the paperless recorder is strong: every event is timestamped, and the instrument keeps separate circular logs — 256 alarm records, 256 power records and 256 operation log entries — so a flat line can be explained. Power-down records store power-down time, power-up time and duration, which is exactly what you need when a trend shows a gap. Configuration is password protected, and the whole setup can be exported and imported between units of the same type for repeatability.
Where the paperless recorder is weak, and what to do about it:
- Cyclic overwrite is silent. Oldest records are replaced by newest without a "memory full" warning. This is the single most important behaviour to design around — see the retention calculation in how to choose a paperless recorder, which gives retention in days as roughly 320 × recording interval in seconds ÷ channel count.
- History is stored as a percentage of range. Change a channel's signal type or range later and previously stored data is re-interpreted against the new range. Record the ranges in the commissioning file.
- Clock discipline matters. Adjusting the time forward overwrites overlapping records, so set date, time and device ID before a data campaign, not during one.
- Gaps exist. No historical data is generated while the unit is powered down. That is honest behaviour, but it has to be paired with an uninterruptible supply if a process must be recorded continuously.
For regulated environments (GMP, 21 CFR Part 11 and similar frameworks), neither technology class automatically satisfies the requirement. Those frameworks look for controls such as individual user accounts, electronic signatures and tamper-evident audit trails. Map the specific requirement against the datasheet with your QA team before purchase rather than assuming that "paperless" or "paper" answers it.
Total Cost of Ownership: The Arithmetic, Not a Price Tag
Consumable and labour costs differ enormously between plants, so quotes that compare only purchase price miss the point. Build the comparison from your own numbers with these four expressions:
annual consumable cost = charts per week × 52 × unit cost per chart
                        + pens or ribbons per year × unit cost

annual handling labour = chart changes per week × 52
                         × minutes per change ÷ 60 × loaded labour rate

annual retrieval labour = records requested per year
                          × minutes to locate and copy one record
                          ÷ 60 × loaded labour rate

annual digital overhead = USB media per year × unit cost
                          + backup storage allocation
                          + engineering time to integrate and maintain the data path
Two things typically decide the outcome. First, the labour terms scale with plant size and audit frequency, while consumable terms scale with the number of recorders — a facility running twelve chart recorders feels the consumable line, and a facility audited monthly feels the retrieval line. Second, the digital side has a one-off engineering cost (integration, tag naming, backup routine) that a fair comparison spreads over the instrument's service life rather than charging to year one.
A recorder also carries an 18-month warranty and a one-hour response commitment from the manufacturer in this example — worth converting into a number as well, because downtime on a recorded process is usually more expensive than the instrument.
Migration: Cutting Over Without Losing Continuity
Replacing a chart recorder does not have to be a step change, and it should not be, because the moment you remove the old instrument you lose its record.
- Feed both instruments. The R72 can retransmit up to 8 channels as 4–20 mA (load ≤750 Ω, 0.2 % accuracy). Use those outputs to keep the existing chart recorder plotting while the paperless unit records the same signals.
- Commission the digital side properly first. Set date and time, assign a meaningful 16-character device ID, tag each channel with its unit, and export the configuration to USB as a baseline.
- Run one full reporting cycle in parallel. Compare what each instrument produces for the same week — this is where wiring, scaling and interval mistakes surface, while the old record still exists as a fallback.
- Decide the retention policy before you switch off the chart drive. If the process needs continuous coverage, put the recorder on a supply that survives the outage; if the record needs to survive a memory overwrite, set the automatic daily export and test it.
- File the configuration export with the panel drawings. A recorder that fails is replaced in an hour if its configuration exists as a file, and rebuilt over two days if it does not.
The Comparison, Side by Side
| Dimension | Chart recorder | Paperless recorder (R72) |
|---|
| Record medium | Paper chart plus pen trace | 64 MB internal memory, cyclic overwrite |
| Channel count | Limited by pen count | Up to 32 isolated universal inputs |
| Signal types | Typically 4–20 mA and thermocouple inputs by model | Current, voltage, mV, thermocouple, RTD and frequency, set in firmware per channel |
| Record interval | Fixed by chart speed | Selectable from 1 s to 1 h |
| Read at the panel | Continuous analogue trace | Digital, bar, dashboard and trend screens on a 7-inch touch display |
| Alarm outputs | Usually limited, by model | Up to 16 normally open relays, 250 VAC 3 A / 30 VDC 3 A resistive; hysteresis and delay settings control contact chatter |
| Remote data access | None | RS485 Modbus RTU and Ethernet Modbus TCP (3 connections) |
| Getting a copy | Remove the chart | USB export (.PLR file opened by PLR.EXE), print, or registers |
| Event evidence | Handwritten annotations | 256 alarm, 256 power and 256 operation log entries, timestamped |
| Consumables | Charts, pens, ink | None |
| Panel depth | Set by the chart drive and paper path | Fixed: 187 × 147 × 145 mm body, 138 × 138 mm cut-out |
| Protection at the panel | Model dependent | IP65 at the panel face, indoor panel mounting |
A Realistic Reading of the Choice
Chart recorders are the right answer when a signed paper strip is the deliverable, the panel has depth to spare, and nobody needs the data remotely. Paperless recorders are the right answer when channel count is growing, when someone has to produce a timestamped record from three weeks ago in under five minutes, or when the data has to reach a PLC, SCADA or historian without a manual step.
The failure mode to avoid is the middle case: installing a paperless recorder and running it exactly like a chart recorder — nobody reading the screen, no export scheduled, no backup of the configuration. That configuration has every weakness of the paperless approach and none of its advantages.
Frequently Asked Questions
Q: Is a paperless recorder more accurate than a chart recorder?
A: Accuracy depends on the input specification, not the display medium. The R72's current and voltage inputs are specified at ±0.2 %, with overall instrument accuracy quoted as 0.2 % F.S. at 25 °C after a 30-minute warm-up. What changes with a paperless recorder is resolution and readability of the record — a 1-second interval and a 7-inch trend display show detail that a pen trace physically cannot.
Q: Do I still need paper charts for audits?
A: Only if a specific procedure requires a signed physical strip. Some quality systems do. The R72 can drive an optional TTL micro printer to print digital values or curves automatically or on demand, with printable channel tags, timestamps and up to three titles, but the primary record is digital — so define the retention and export policy for the digital file itself.
Q: What happens to the record if the power fails?
A: Stored history survives the outage; no data is generated while the unit is off, so the trend shows a gap rather than an interpolated line. Each power cycle is logged with power-down time, power-up time and duration in a 256-entry circular log. If the process must be recorded without gaps, put the recorder on a supply that rides through the outage.
Q: How long can a paperless recorder hold data before it overwrites?
A: Retention depends on channel count and recording interval. Estimate it as retention in days ≈ 320 × recording interval in seconds ÷ channel count, which matches the published figures for this 64 MB platform. Cyclic overwrite is silent, so pair the calculation with a scheduled USB export.
Q: Can a paperless recorder drive the old chart recorder during a migration?
A: Yes. Up to 8 channels can be retransmitted as 4–20 mA with a load of up to 750 Ω at 0.2 % accuracy, so both instruments can plot the same signal while you validate the new installation. Once the parallel run is complete, the retransmission outputs can be reassigned to the control system instead.
Q: How much panel depth does a paperless recorder need?
A: A fixed 145 mm behind a 138 × 138 mm cut-out for this model, with no paper path to service. That is usually less than the chart drive it replaces, but measure the actual enclosure before ordering — a terminal shroud or a DIN rail behind the panel can reduce the usable depth.
Q: Is it worth keeping one chart recorder in the plant?
A: If a procedure requires a signed strip, keep one instrument that can produce it, or add the printer option to the paperless recorder. Running two full parallel recording systems "just in case" usually costs more in labour than the redundancy is worth, once the export routine is working.
Planning a Replacement?
If you are converting a chart recorder panel, send us the channel list, the signals already wired to the old instrument, and the depth available behind the panel. We will confirm the cut-out, the input types and the retransmission plan so the old recorder can stay online until the new one has proved itself.
Plan a chart recorder replacement · Browse paperless recorders
About the Manufacturer
This guide is published by Jujie Automation (Anhui Jujie Automation Technology Co., Ltd.), a National High-Tech Enterprise founded in 2016 and specializing in process measurement and automation instrumentation for 10+ years. Our product portfolio covers flow meters, pressure and temperature instruments, level instruments, water quality analyzers, recorders and turnkey control systems — manufactured in our own plant in Wuhu, Anhui, and calibrated in our in-house calibration laboratory with traceable data on every unit.
Quality and compliance: ISO 9001, ISO 14001 and ISO 45001 management systems, CE, RoHS, TUV and SGS certification, and a five-stage quality process that includes 100 % incoming material inspection, individual calibration, 72-hour burn-in under temperature extremes and EMI stress, and a unique serial number for full lifecycle traceability. Products are in service with more than 350,000 customers across 160+ countries, backed by an 18-month warranty, a one-hour response commitment and lifetime maintenance support.
Editorial note: all R72 parameters quoted here are taken from the touch color paperless recorder user manual. Chart recorder characteristics are described generically; consumable, labour and retrieval costs are presented as calculation frameworks rather than example prices, because they depend on your plant's rates.
Ethan Liu
Ethan Liu is JUJEA's technical content specialist, translating complex sensor integration and industrial automation concepts into practical insights for engineers, system integrators, procurement professionals, and decision-makers worldwide.


 한국어
한국어 français
 Deutsch
 Español
 italiano
 русский
 português
 العربية
 tiếng việt
 čeština